When running aggregations for reporting in some situations outliers can throw out the numbers.
For example lets say we have a report that shows the quantity of stock lines delivered to the the many warehouses of company X per day. Then lets imagine that a few times a year company X opens a new warehouse and fully stocks it. This particular report is used to predict lines coming in any any given day and is not interested in the opening of new warehouses, the dataset will throw these values out by including the quantities when fully stocking a warehouse from scratch.
There are a few ways we could handle this possibly the simplest would be to filter out quantities going to a new warehouse as part of it’s initial stock but for the sake of this example lets pretend that’s not an option. In this case we need to find the outliers (values that fall outside of the norm) and filter them out of our reports.
One approach would be to sort by quantity and filter out the bottom and top X% to remove the outliers this however will not be very accurate as it will remove data that falls inside normal stocking quantities and possibly leave values in that fall outside the normal range. Another better option for our scenario is to work out what a normal range is and filter out values that fall outside of that range.
To do this was can obviously use the AVG function to get an average quantity but then how far either side of that value do we allow through our filter? Enter Standard Deviation
The Wikipedia definition of Standard Deviation is…
a measure that is used to quantify the amount of variation or dispersion of a set of data values.
What does this really mean though? It’s really the normal range away from the average that values fall.
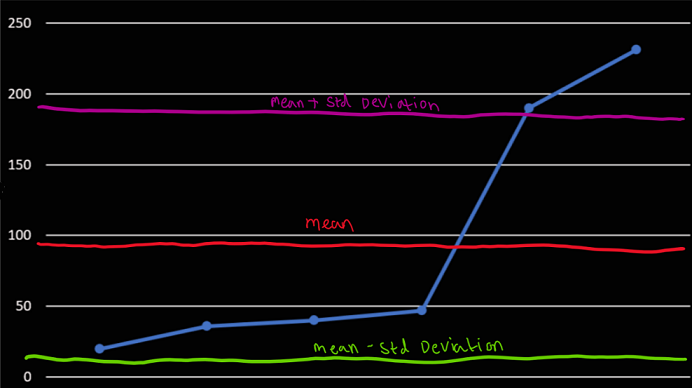
Let’s imagine we have the following values…
20, 36, 40, 47, 190, 231
The mean average of these numbers is 96. If we were removing outliers here just by eye we can see the numbers that probably should be filtered out are 190 and 231.
SQL Server has functions built in for calculating standard deviation but lets take a look at how to do this manually to understand what’s going on when you use it.
The formula for calculating standard deviation is quite simple it’s just √Variance where variance is the mean of the squared differences from the mean. Sound confusing? It’s really not, lets break it down and apply it to our sample above.
So our mean is 94
Then we take the difference of each number from the mean and square it
| Value | Diff From Mean | Diff Squared |
|---|---|---|
| 20 | 74 | 5476 |
| 36 | 58 | 3364 |
| 40 | 54 | 2916 |
| 47 | 45 | 2025 |
| 190 | 96 | 9216 |
| 231 | 137 | 18796 |
If we then calculate the mean of those squares we get our variance which is 6965.5. If we then square root this we get our standard deviation of 83.459. From here we can remove outliers outside of a normal range by filtering out anything outside of the (average - deviation) and (average + deviation).
Mean + deviation = 177.459 and mean - deviation = 10.541 which leaves our sample dataset with these results…
20, 36, 40, 47
Now that we’ve covered the math that goes into calculating this lets look at how we’d write this as a SQL Query…
DECLARE @StdDev DECIMAL(5,2)
DECLARE @Avg DECIMAL(5,2)

SELECT
   @StdDev = STDEV(Qty),
   @Avg = AVG(Qty)
FROM Sales

SELECT
   *
FROM
   Sales
WHERE
   Qty > @Avg - @StdDev AND
   Qty < @Avg + @StdDev
As you can see SQL makes this pretty easy to do. This seems like a great time to throw in a cheesy quote just because…
With great power comes great responsibility
Be very careful when filtering out outliers as you’re potentially ignoring valid data and throwing out your aggregations. This technique should only be used when you have a genuine reason to ignore the outliers and are well aware of what causes them.