Since SQL Server 2014 SP1 we’ve had DMV’s that can support Live Query Statistics (Basically a query plan that gives you feedback as it runs). If you’ve not seen this before then you can give it a go by…
- Connect to any SQL Server instance from 2014 SP1.
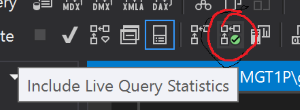
- Find a query that takes more than a few seconds to run.
-
Click the Live Query Statistics
-
Run the query
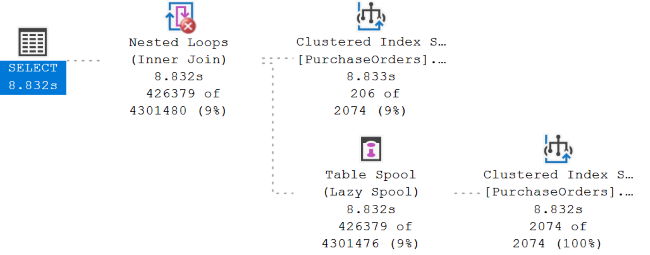
This can be really useful for finding out how much time a query is spending on each operation and tracking down bottlenecks. Unfortunately this gets a bit more difficult when you want this data for queries being run by other people on the server.
Trace Flag 7412
If you’re running SQL Server 2016 SP1 and up to the latest version of 2017 this trace flag enables lightweight profiling of all queries, this profile will get the same information you get from the live query statistics. If you’re running SQL Server 2019 then this flag is on by default. This flag does have overhead (Nothing is for free, despite the song), I’ve seen estimates of about 2% so if you are enabling it on production systems make sure you do some testing with your base load. To see how to enable this see my post on Trace Flags.
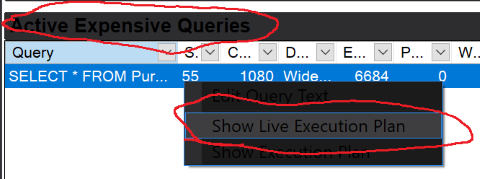
Once enabled you can do a couple of new things. In the SSMS Activity Monitor if you expand “Active Expensive Queries” you can right click them and view the live statistics.
We also now get this new profile information for currently running queries in the sys.dm_exec_query_profiles DMV. There are a number of cool things you can do with this information, I wrote the following script to see statuses of running queries and how far through they are (Remember these will go over 100% when estimates are out, e.g If it estimates 1 row but returns 10 this will give a 1000% complete indication)
SELECT
   p.node_id NodeId,
   p.session_id SessionId,
   p.request_id RequestId,
   [sql].[text] [SQL],
   p.physical_operator_name [PlanOperator],
   obj.name AS  [Object],
   ix.name AS  [Index],
   SUM(p.estimate_row_count) [EstimatedRows],
   SUM(p.row_count) [ActualRows],
   CAST(CAST(SUM(p.row_count) * 100 / SUM(p.estimate_row_count) AS DECIMAL(5,2)) AS VARCHAR(6)) + ' %' Progress,
   'SELECT query_plan FROM sys.dm_exec_query_plan (' + CONVERT(VARCHAR(MAX),plan_handle,1) + ')' GetPlan
FROM
   sys.dm_exec_query_profiles p
   LEFT JOIN sys.objects obj ON p.object_id = obj.object_id
   LEFT JOIN sys.indexes ix ON p.index_id = ix.index_id AND p.object_id = ix.object_id
   CROSS APPLY(
      SELECT node_id
      FROM sys.dm_exec_query_profiles thisDb
      WHERE
         thisDb.session_id = p.session_id AND
         thisDb.request_id = p.request_id AND
         thisDb.database_id = DB_ID()) a
   OUTER APPLY(SELECT * FROM sys.dm_exec_sql_text(sql_handle)) [sql]
GROUP BY p.request_id, p.node_id, p.session_id, p.physical_operator_name, obj.name, ix.name,database_id,[sql].[text],plan_handle
ORDER BY p.session_id, p.request_id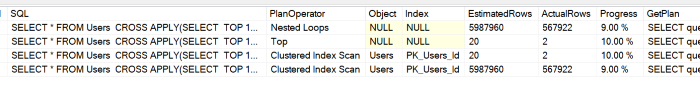
This information can also be really helpful for finding queries with wildly bad estimates as a possible starting point for optimization.
In the last column I also included the TSQL to get the query plan, just copy this column and run it to see the plan.