In writing some sample demos around LOB and Row-Overflow data I found a couple of oddities in the way reads are reported in STATISTICS IO and query plans, There is every chance I’m missing something obvious here and if that is the case then please let me know as I’d love to understand this more.
The following is what I have observed on SQL Server 2017…
- If I turn on Statistics IO and query a table with no LOB allocations but some Row-Overflow allocations I see LOB logical reads occurring
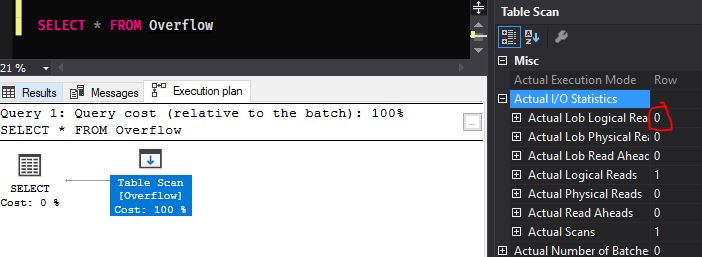
- If I run that same query and look at the actual execution plan under Actual I/O Statistics no LOB reads are reported
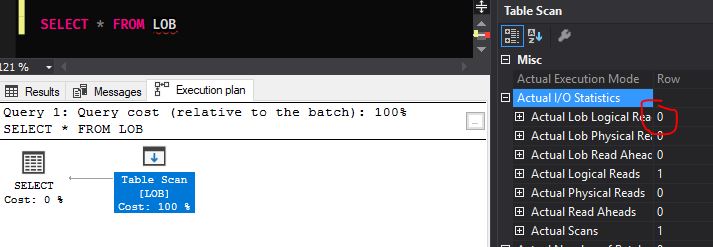
- If I create a new table with a column that will be put in LOB storage the query plan still reports zero LOB logical reads even though STATISTICS IO returns a number greater than zero.
Let’s look at these examples…
Setup
First lets create a sandbox database…
CREATE DATABASE AllocationUnitSandbox
GO
USE AllocationUnitSandbox
GO
Then lets add a little stored procedure we can run throughout our examples to see the allocation units…
CREATE PROCEDURE GetAllocationUnits AS
SELECT
   o.name ObjectName,
   i.name IndexName,
   i.type_desc IndexType,
   au.type_desc AllocationUnitDesc,
   au.total_pages AllocationUnitTotalPages,
   au.used_pages AllocationUnitUsedPages,
   fg.name AS FileGroupName
FROM
   sys.allocation_units au
   LEFT JOIN sys.filegroups fg ON fg.data_space_id = au.data_space_id
   LEFT JOIN sys.partitions p ON
      (au.type_desc IN ('IN_ROW_DATA','ROW_OVERFLOW_DATA') AND p.hobt_id = au.container_id)
      OR (au.type_desc IN ('LOB_DATA') AND p.partition_id = au.container_id)
   LEFT JOIN sys.objects o ON o.object_id = p.object_id
   LEFT JOIN sys.indexes i ON
      i.object_id = o.object_id
      AND i.index_id = ISNULL(p.index_id,0)
WHERE
   o.[type] NOT IN ('S','IT') /*SystemTable, InternalTable*/
In-Row Demo
Before we look at any Row-Overflow or LOB allocation units lets take this simple example where all the data fits In-Row.
CREATE TABLE InRow(Field1 VARCHAR(100), Field2 VARCHAR(100))
INSERT INTO InRow(Field1, Field2)
VALUES(REPLICATE('a',100), REPLACE('b',100))
Then lets check out GetAllocationUnits procedure…
EXEC GetAllocationUnitsWe can see we have a single allocation unit for In-Row pages on this table. If we now run a SELECT * with statistics IO turned on we should see a single logical read…
SET STATISTICS IO ON
SELECT * FROM InRow
Bingo.
Overflow-Row Demo
Let’s now create a table with no fields that qualify for LOB but enough variable length for us to cause overflows…
CREATE TABLE Overflow
(
    Field1 VARCHAR(100),
    Field2 VARCHAR(8000)
)
INSERT INTO Overflow(Field1,Field2)
VALUES(REPLICATE('a',100),REPLICATE('b',8000))
If we then run our GetAllocationUnits procedure we should see that we have some data in row and some in overflow due to the fact we can’t fit our 100 length field1 and our 8000 length field2 on a single page…
EXEC GetAllocationUnitsIf we then run a select * we’d expect to have to read at least 2 pages, one from the In-Row allocation unit and one from our Overflow-Row allocation unit…
SET STATISTICS IO ON
SELECT * FROM Overflow
I’m still not sure about this reporting as a LOB read when it’s really Row-Overflow but I guess it is what it is. What I really find odd is that if we run the above query again but turn on actual query plans we see no LOB reads…
LOB Data Demo
Where this gets even weirder is if we then create another table that has real LOB data…
CREATE TABLE LOB
(
    Field1 VARCHAR(100),
    Field2 VARCHAR(MAX)
)
INSERT INTO LOB(Field1,Field2)
VALUES(REPLICATE('a',100), REPLICATE('b',10000))

EXEC GetAllocationUnits
Now let’s do select * again…
SET STATISTICS IO ON
SELECT * FROM LOB
As expected we can see our LOB reads however if we switch back to our actual execution plan…
Still now LOB reads showing under Actual I/O Statistics.
I’ve even tried running the insert statement multiple times to increase the page count, STATISTICS IO ON correctly reports the read pages but my actual execution plan stays the same with zero LOB pages read. Weird Right?


