SQL Server statistics are often thought of as a bit of a black box, this is completely not the case and I want to use this post to detail what they are, how they work and how we can view what they’re doing….
What Are Statistics
Statistics data is information SQL Server stores about what’s in your tables, SQL then uses this data to work out how to generate optimized query plans.
For a simplistic example imagine we have a query to get a user by username the table has a clustered index on Id and a nonclustered index on username. For information about nonclustered indexes see SQL Server Clustered & NonClustered Indexes Explained.
There is more than one way SQL can perform this query for example
- It could perform a table scan and go through each row in the table one by one, check if the username is a match and return the results
- It could use the non clustered index that we’ve put on username to seek to the record in the index and then perform a key lookup back to the clustered index to get the the rest of the fields our query asked for.
This is a very simple example so there is not much in each of these methods but we can image that choosing which of the above methods is fastest could depend heavily on the volume and kind of data that is stored in the table. Run the following script on a new database to setup our test table and seed it with data.
DROP TABLE [User]

CREATE TABLE [User]
(
    Id INT IDENTITY PRIMARY KEY NONCLUSTERED,
    Username NVARCHAR(100),
    Firstname NVARCHAR(100),
    LastName NVARCHAR(100),
    PlaceOfBirth NVARCHAR(100)
)

CREATE NONCLUSTERED INDEX ndx_user_username ON [dbo].[user](username)

--Insert Some Seed Data
INSERT INTO [dbo].[User]
    (
    Username,
    FirstName,
    LastName
	)
VALUES
    ('clairetemple','Claire','Temple'),
    ('lukecage','Luke','Cage'),
    ('jessiejones','Jessie','Jones'),
    ('tonystark','Tony','Stark'),
    ('mattmurdock','Matt','Murdock')
If we then run a simple select query on our User table with 5 records which method will it choose to get the data?
SELECT
    Username, Id
FROM
    [dbo].[User]
WHERE
    [User].Username = 'lukecage'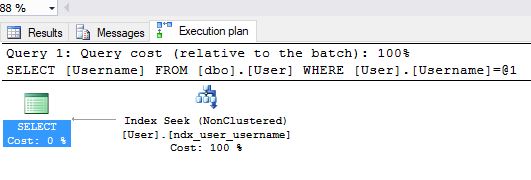
We can see that with a small amount of data SQL Server created a plan that performs a table scan. This is because it knows there is a very small amount of data and has decided in this case a table scan is quicker than an index seek with a key lookup. Let’s now add a few thousand users to our table
DELETE FROM [Dbo].[User]
INSERT INTO [dbo].[User]
    (
    Username,
    FirstName,
    LastName
	)
VALUES
    ('clairetemple','Claire','Temple'),
    ('lukecage','Luke','Cage'),
    ('jessiejones','Jessie','Jones'),
    ('tonystark','Tony','Stark'),
    ('mattmurdock','Matt','Murdock')

DECLARE @LoopCount INT = 1
WHILE @LoopCount < 10
    BEGIN
    INSERT INTO [dbo].[User](Username,FirstName,LastName)
    SELECT
        CAST(@LoopCount AS NVARCHAR(4)) + Username,
        CAST(@LoopCount AS NVARCHAR(4)) + FirstName,
        CAST(@LoopCount AS NVARCHAR(4)) + LastName
    FROM [dbo].[User]
    SET @LoopCount = @LoopCount +1
    END
If we then repeat our select query the plan will now use our nonclustered index to seek to the username we’re searching for.
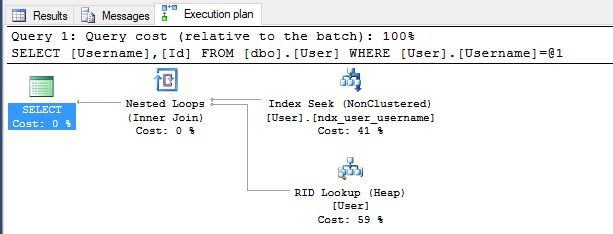
We can see at this point SQL has decided a table scan is no longer optimal and has switched to using an index seek. SQL Server doesn’t directly look at the table data before each query as that would be far to slow, instead it stores statistics on the volume and shape of the data in each table, then when creating a query plan it looks at the statistics to see which approach it thinks will perform best. Given the statistics for a given column SQL Server can estimate how many values fall within a given range which can then be used to estimate the row counts for each step of our query plan to find the best path.
When Are Statistics Created/Updated
Statistics are not updated in real time, when auto update statistics is enabled then they are updated after a threshold percentage of records is added or updated.. There are however a number of techniques SQL Server uses to still estimate row counts for given ranges on out of date statistics which we will discuss below.
If you want to follow along then every time I say recreate the table run this script…
DROP TABLE [User]

CREATE TABLE [User]
(
    Id INT IDENTITY PRIMARY KEY NONCLUSTERED,
    Username NVARCHAR(100),
    Firstname NVARCHAR(100),
    LastName NVARCHAR(100),
    PlaceOfBirth NVARCHAR(100)
)

CREATE NONCLUSTERED INDEX ndx_user_username ON [dbo].[user](username)

INSERT INTO [dbo].[User]
    (
    Username,
    FirstName,
    LastName
	)
VALUES
    ('clairetemple','Claire','Temple'),
    ('lukecage','Luke','Cage'),
    ('jessiejones','Jessie','Jones'),
    ('tonystark','Tony','Stark'),
    ('mattmurdock','Matt','Murdock')

DECLARE @LoopCount INT = 1
WHILE @LoopCount < 10
    BEGIN
    INSERT INTO [dbo].[User](Username,FirstName,LastName)
    SELECT
        Username,
        FirstName,
        LastName
    FROM [dbo].[User]
    SET @LoopCount = @LoopCount +1
    END
We can use the sys.stats view in SQL Server to see what stats we have on our newly created User table..
SELECT
    s.name AS statistics_name,
    c.name AS column_name,
    sc.stats_column_id,
    s.auto_created
FROM
    sys.stats AS s
    INNER JOIN sys.stats_columns AS sc ON s.object_id = sc.object_id AND s.stats_id = sc.stats_id
    INNER JOIN sys.columns AS c ON sc.object_id = c.object_id AND c.column_id = sc.column_id
WHERE
s.object_id = OBJECT_ID('dbo.User'); 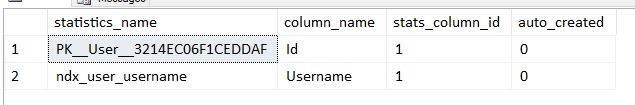
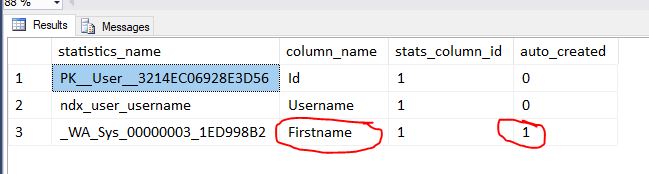
You can see we have 2 statistics collections one for each of the indexes our table has. SQL created these stats when we created the index. So what happens when we query and predicate on one of the columns not indexed? Assuming auto create stats is turned on (it is by default) then a new statistics object will be automatically created for that column…
SELECT * FROM [User] WHERE Firstname = 'Luke'If you then run the sys.stats query above you’ll see we now have statistics object for firstname…
Let’s have a look at what’s stored in the new firstname statistics, we can do this with the DBCC Show_Statistics function which takes the name of the table followed by the statistics name
DBCC SHOW_STATISTICS('dbo.User','_WA_Sys_00000003_20C1E124') WITH STAT_HEADER
From this we can see when the statistics were last updated and also how many rows of the full data it sampled to generate itself.
We can view the density information in this statistics object by running
DBCC SHOW_STATISTICS('dbo.User','_WA_Sys_00000003_20C1E124') WITH DENSITY_VECTOR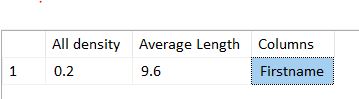
This is quite interesting as we can see an all density of 0.2. In our case we have 5 distinct firstnames and 0.2 * 5 = 1 which is how density is calculated, the lower the number the more distinct data you have. We’ll come to how this is useful in a little bit.
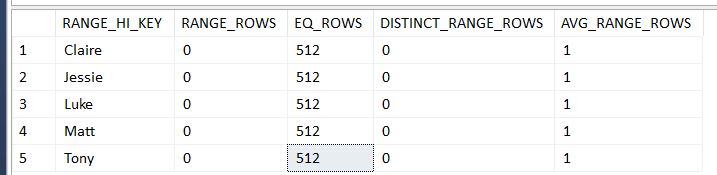
Lastly we have the Histogram option on SHOW_STATISTICS…
DBCC SHOW_STATISTICS('dbo.User','_WA_Sys_00000003_24927208') WITH HISTOGRAMData will normally be a lot more distinct than in our sample but we can see we have 512 firstnames in each range…
I mentioned above the Statistics are not live and can go long periods without being updated. Depending on your SQL version the default settings are set around 20%. So a table with 5000 records will update it’s statistics when 1000 updates or inserts are made. More about this can be found here MSDN Statistics…
- SQL Server (2014 and earlier) uses a threshold based on the percent of rows changed. This is regardless of the number of rows in the table.
- SQL Server (starting with 2016 and under the compatibility level 130) uses a threshold that adjusts according to the number of rows in the table. With this change, statistics on large tables will be updated more often.
Let’s imagine we have a table with 1 Million records, given the rules above that means that 200,000 rows can be changed or added before statistics are updated. In this case SQL uses things like it’s density measures and histogram steps to predict the amount of data a given operation will touch to generate an optimized plan. This works really well when the new data follows a similar cardinality pattern to the data in the statistics but can cause estimates and query plans if the new data changes this cardinality.
Out Of Date Statistics Estimating Correctly
Let’s run through an example of how out of date statistics can still generate good estimates.
- Reset and reseed the database with the scripts above.
- Run our firstname query again to build the statistics for the firstname column
SELECT * FROM [User] WHERE Firstname = 'Luke'- Get the name of our auto created statistic
SELECT
    s.name AS statistics_name,
    c.name AS column_name,
    sc.stats_column_id,
    s.auto_created
FROM
    sys.stats AS s
    INNER JOIN sys.stats_columns AS sc ON s.object_id = sc.object_id AND s.stats_id = sc.stats_id
    INNER JOIN sys.columns AS c ON sc.object_id = c.object_id AND c.column_id = sc.column_id
WHERE
s.object_id = OBJECT_ID('dbo.User'); - Run SHOW_STATISTICS to get the histogram
DBCC SHOW_STATISTICS('dbo.User','Put Statistic Name Here') WITH HISTOGRAM
At this point our statistics are up to date, so if we turn on query plans and run our select query again
SELECT * FROM [User] WHERE Firstname = 'Luke'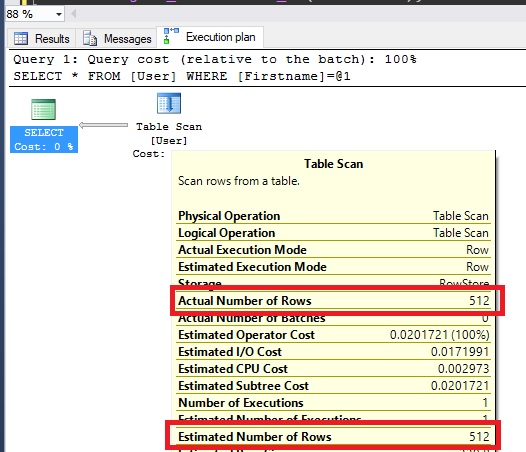
We can see the estimated number of rows is the same as the actual. Now lets add one row for each existing user, this wont cause the statistics to update because we’re not changing enough records.
INSERT INTO [dbo].[User]
    (
    Username,
    FirstName,
    LastName
	)
VALUES
    ('clairetemple','Claire','Temple'),
    ('lukecage','Luke','Cage'),
    ('jessiejones','Jessie','Jones'),
    ('tonystark','Tony','Stark'),
    ('mattmurdock','Matt','Murdock')
Run the SELECT query above again and you’ll see estimated 513, actual 513. So if the statistics are out of date how did SQL server get this figure?
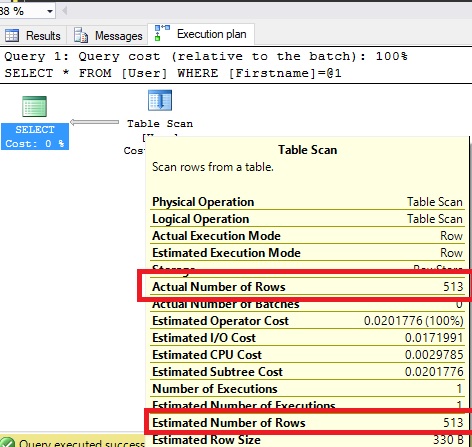
SQL Server knows when the statistics were built there were 2560 rows and it also knows there are now 2565 rows. If we check the density of the statistics by running…
DBCC SHOW_STATISTICS('dbo.User','Put Statistic Name Here') WITH DENSITY_VECTORWe can see 0.2 so we can see for a given range in the histogram e.g RANGE_HI_KEY = Luke the EQ_ROWS = EQ_ROWS + (5*.02) which gives us our value of 513. This is a good example of SQL Server getting accurate results from statistics even when they are out of date.
Out Of Date Statistics Estimating Correctly
Follow steps 1-4 in the above example to reset the data and statistics.
This time however let’s insert 100 new Luke records, this again will not be enough to trigger a statistics update
DECLARE @Count INT = 1
WHILE @Count < 101
	BEGIN
	INSERT INTO [dbo].[User]
		(
		Username,
		FirstName,
		LastName
		)
	VALUES
		('lukecage','Luke','Cage')
	SET @Count = @Count + 1
	END
Let’s then run our Select statement again with actual query plan turned on…
SELECT * FROM [User] WHERE Firstname = 'Luke'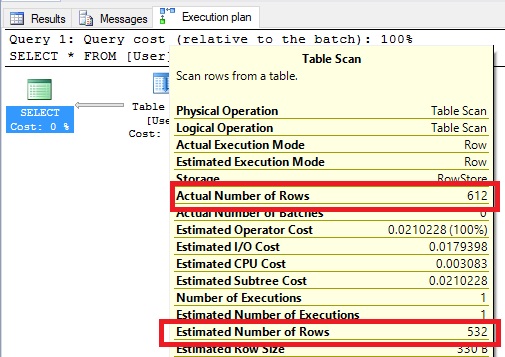
We can see in this case our estimated row count is quite different to our actual row count, in this case the cardinality has changed sufficiently to throw the statistics out.
We can see where this estimate came from by taking the range in our histogram and seeing the count of 512 then using our density value…
Rows In Range + (Density * New Rows)
512 + (0.2 * 100) = 532 (Which matches our query plan estimate)
Hopefully this shows that statistics are not just magic but are predictable things that we can view.
Maintenance
For the most part assuming Auto Update Statistics hasn’t been disabled (It really shouldnt have been unless you have a good reason) SQL Server will manage the statistics without you having to do anything. There are cases though where the statistics are out of date and the cardinality in histogram no longer accurately reflects the data you are querying. A tell tell sign when this is happening is that when you look at your actual query plans estimated rows it’s radically different from actual rows. If you’re profiling a slow query and notice the difference in Actual/Estimated then it might be worth looking at the statistics to work out why there is a difference and if it could be what’s causing the slower performance.
I mentioned above statistics are normally managed and updated with no manual input needed, however it’s common that maintenance plans run over night in periods of low to no use, you could add a step here to rebuild any out of data statistics. On the subject of maintenance plans Ola Hallengren has created a great one that I’ve used many times before, it will rebuild/reorganize indexes and update statistics allowing you to specify the methods it does this by along with the thresholds things need to be fragmented/out dated by.
If profiling is showing a statistics object to be really giving a query problems you can manually rebuild that statistic using the UPDATE STATISTICS
UPDATE STATISTICS [dbo].[user] (StatisticName) You can pass Sample counts into update statistics to limit the amount of rows SQL will sample and speed things up more information on this can be found on the Update Statistics MSDN page.